
Ad Intelligence · Marketing
20% more return on ad spend
Your ads and competitors' ads decoded into what to run next.
- ↑20% return on ad spend
- ↓15% cost per acquisition
- 25 NU per report
Step 1 of 2
Which brand should we analyse?
We find its real competitors, collect their live ads from the Meta Ad Library and Google Ads Transparency, read the creatives themselves, and turn the patterns into five bets.
- 1 Brand
- 2 Competitors
- 3 Run
Recent analyses
How it works
01
Find the real set
We rank 8 to 10 brands by shared buyer, price band and catchment, using the website to pin down what the company actually sells. Change anything.
02
Collect every live ad
The Meta Ad Library and Google Ads Transparency, searched in parallel: images, copy, calls to action and run dates, filtered to each brand's own ads.
03
Look at the work
A vision pass reads the actual creatives, not just the copy: composition, on-image text, offer, palette and what stops the scroll.
04
Connect the patterns
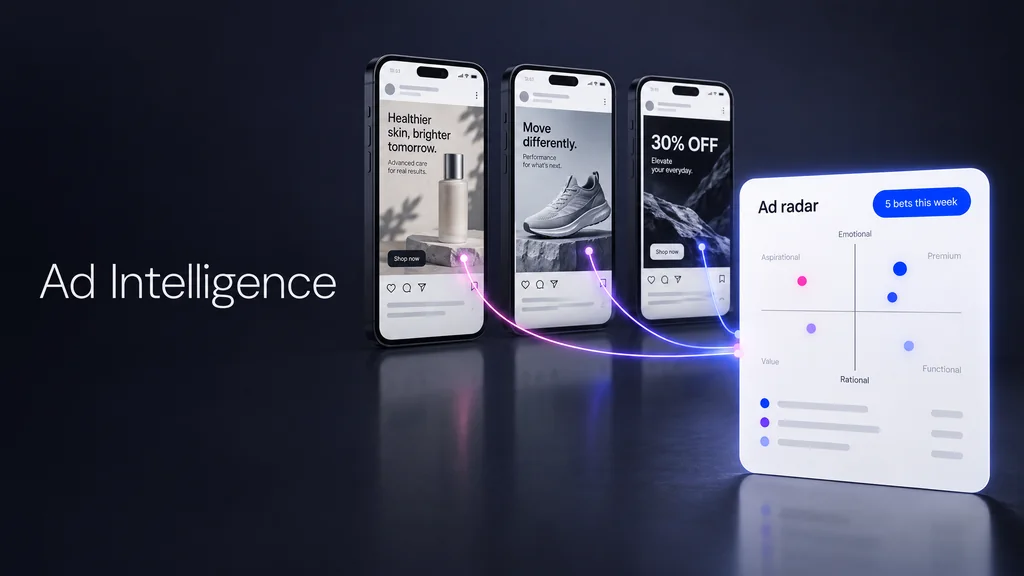
Cross-brand patterns, crowded angles, unclaimed whitespace, and five bets you can build this week, each ready to render as an image or video ad.
What you get
Positioning map
Every competitor plotted on emotional against rational, and proof against aspiration.
Pain-point clusters
The problems three or more brands push on, and the ones nobody touches.
Format and funnel mix
UGC, founder, before and after or product, split from awareness to conversion.
Offer cadence
How discount-heavy each brand is, and what its main offer looks like.
Longevity signals
Which ads are still running after 30, 60 and 90 days, which is what actually works.
Five prioritised bets
Concrete concepts with copy, art direction, channel and a measurable success metric.